Hot days ahead: Adaptation policies in Lanzarote can't wait.
Posted onAdapted from an original post on Lanzarote Futuro.
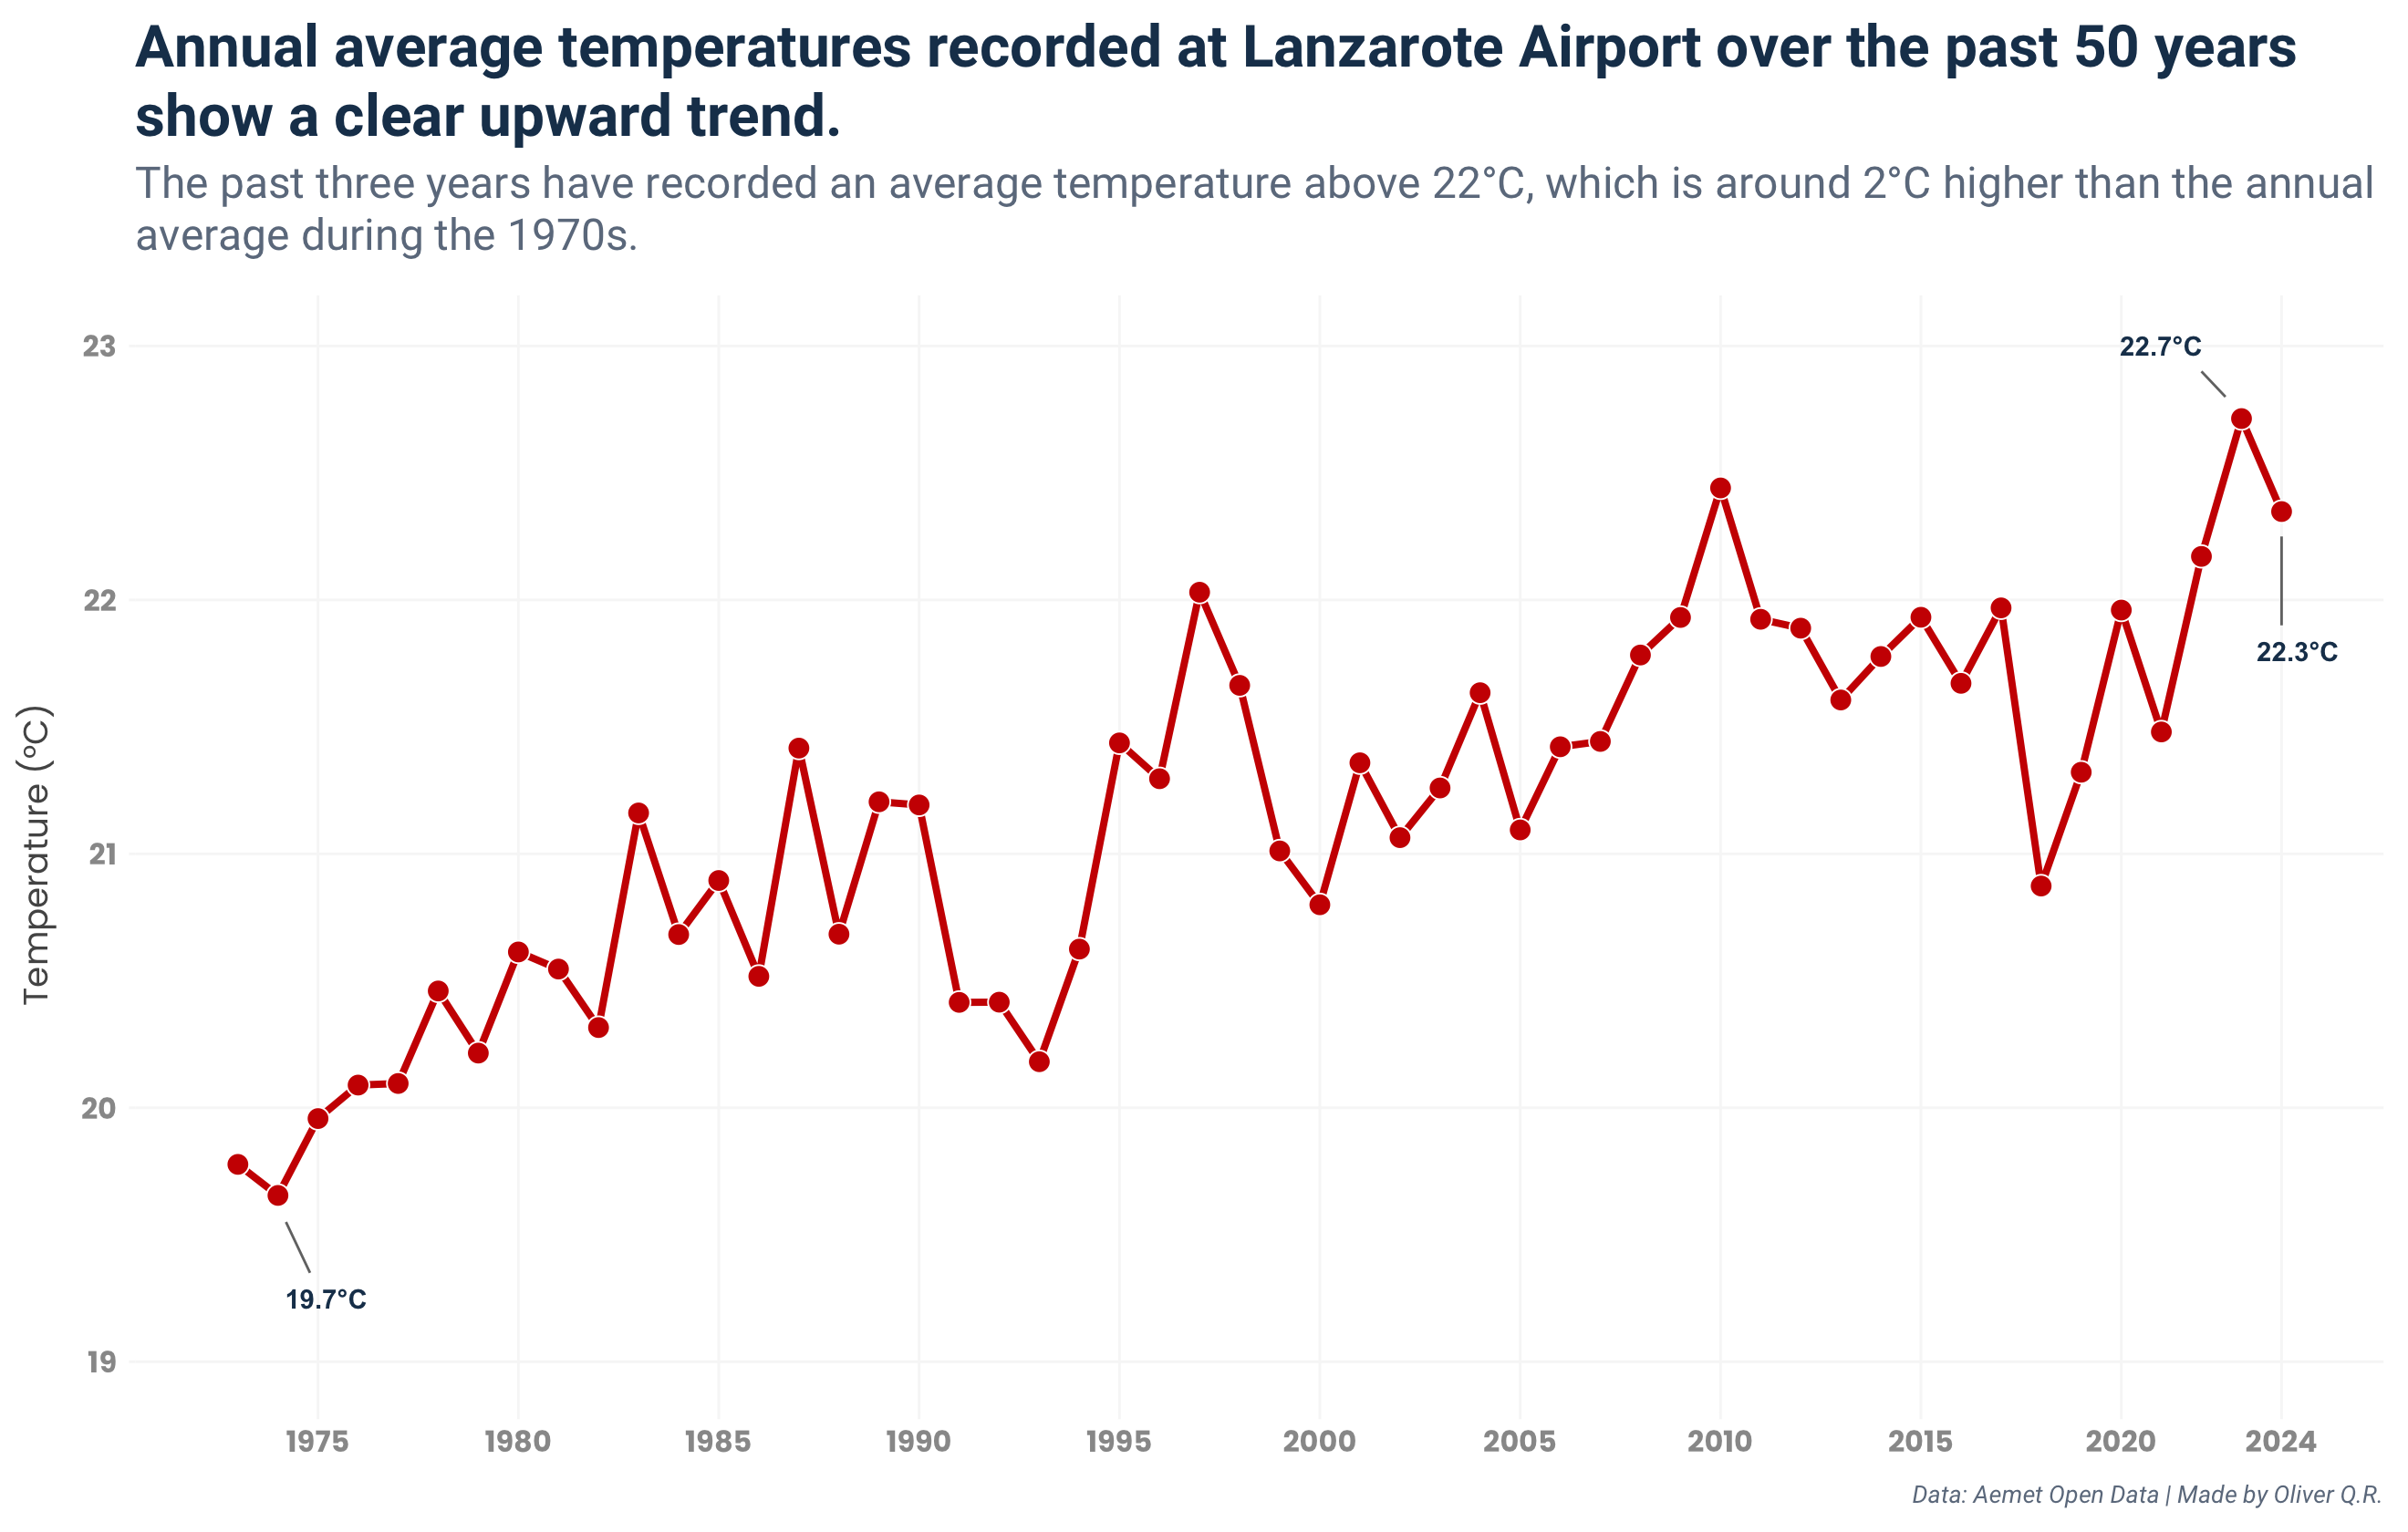
Lanzarote is no exception to global climate change, and data from Aemet recorded at Lanzarote Airport confirms this (fig. 1). Record-breaking years like 2023 and 2010 were the hottest on record, closely followed by 2024, which had a mean annual temperature of 22.3°C (fig. 1). This is almost 1°C higher than the 1991-2020 reference period, and around 2°C higher than the 1970s average.
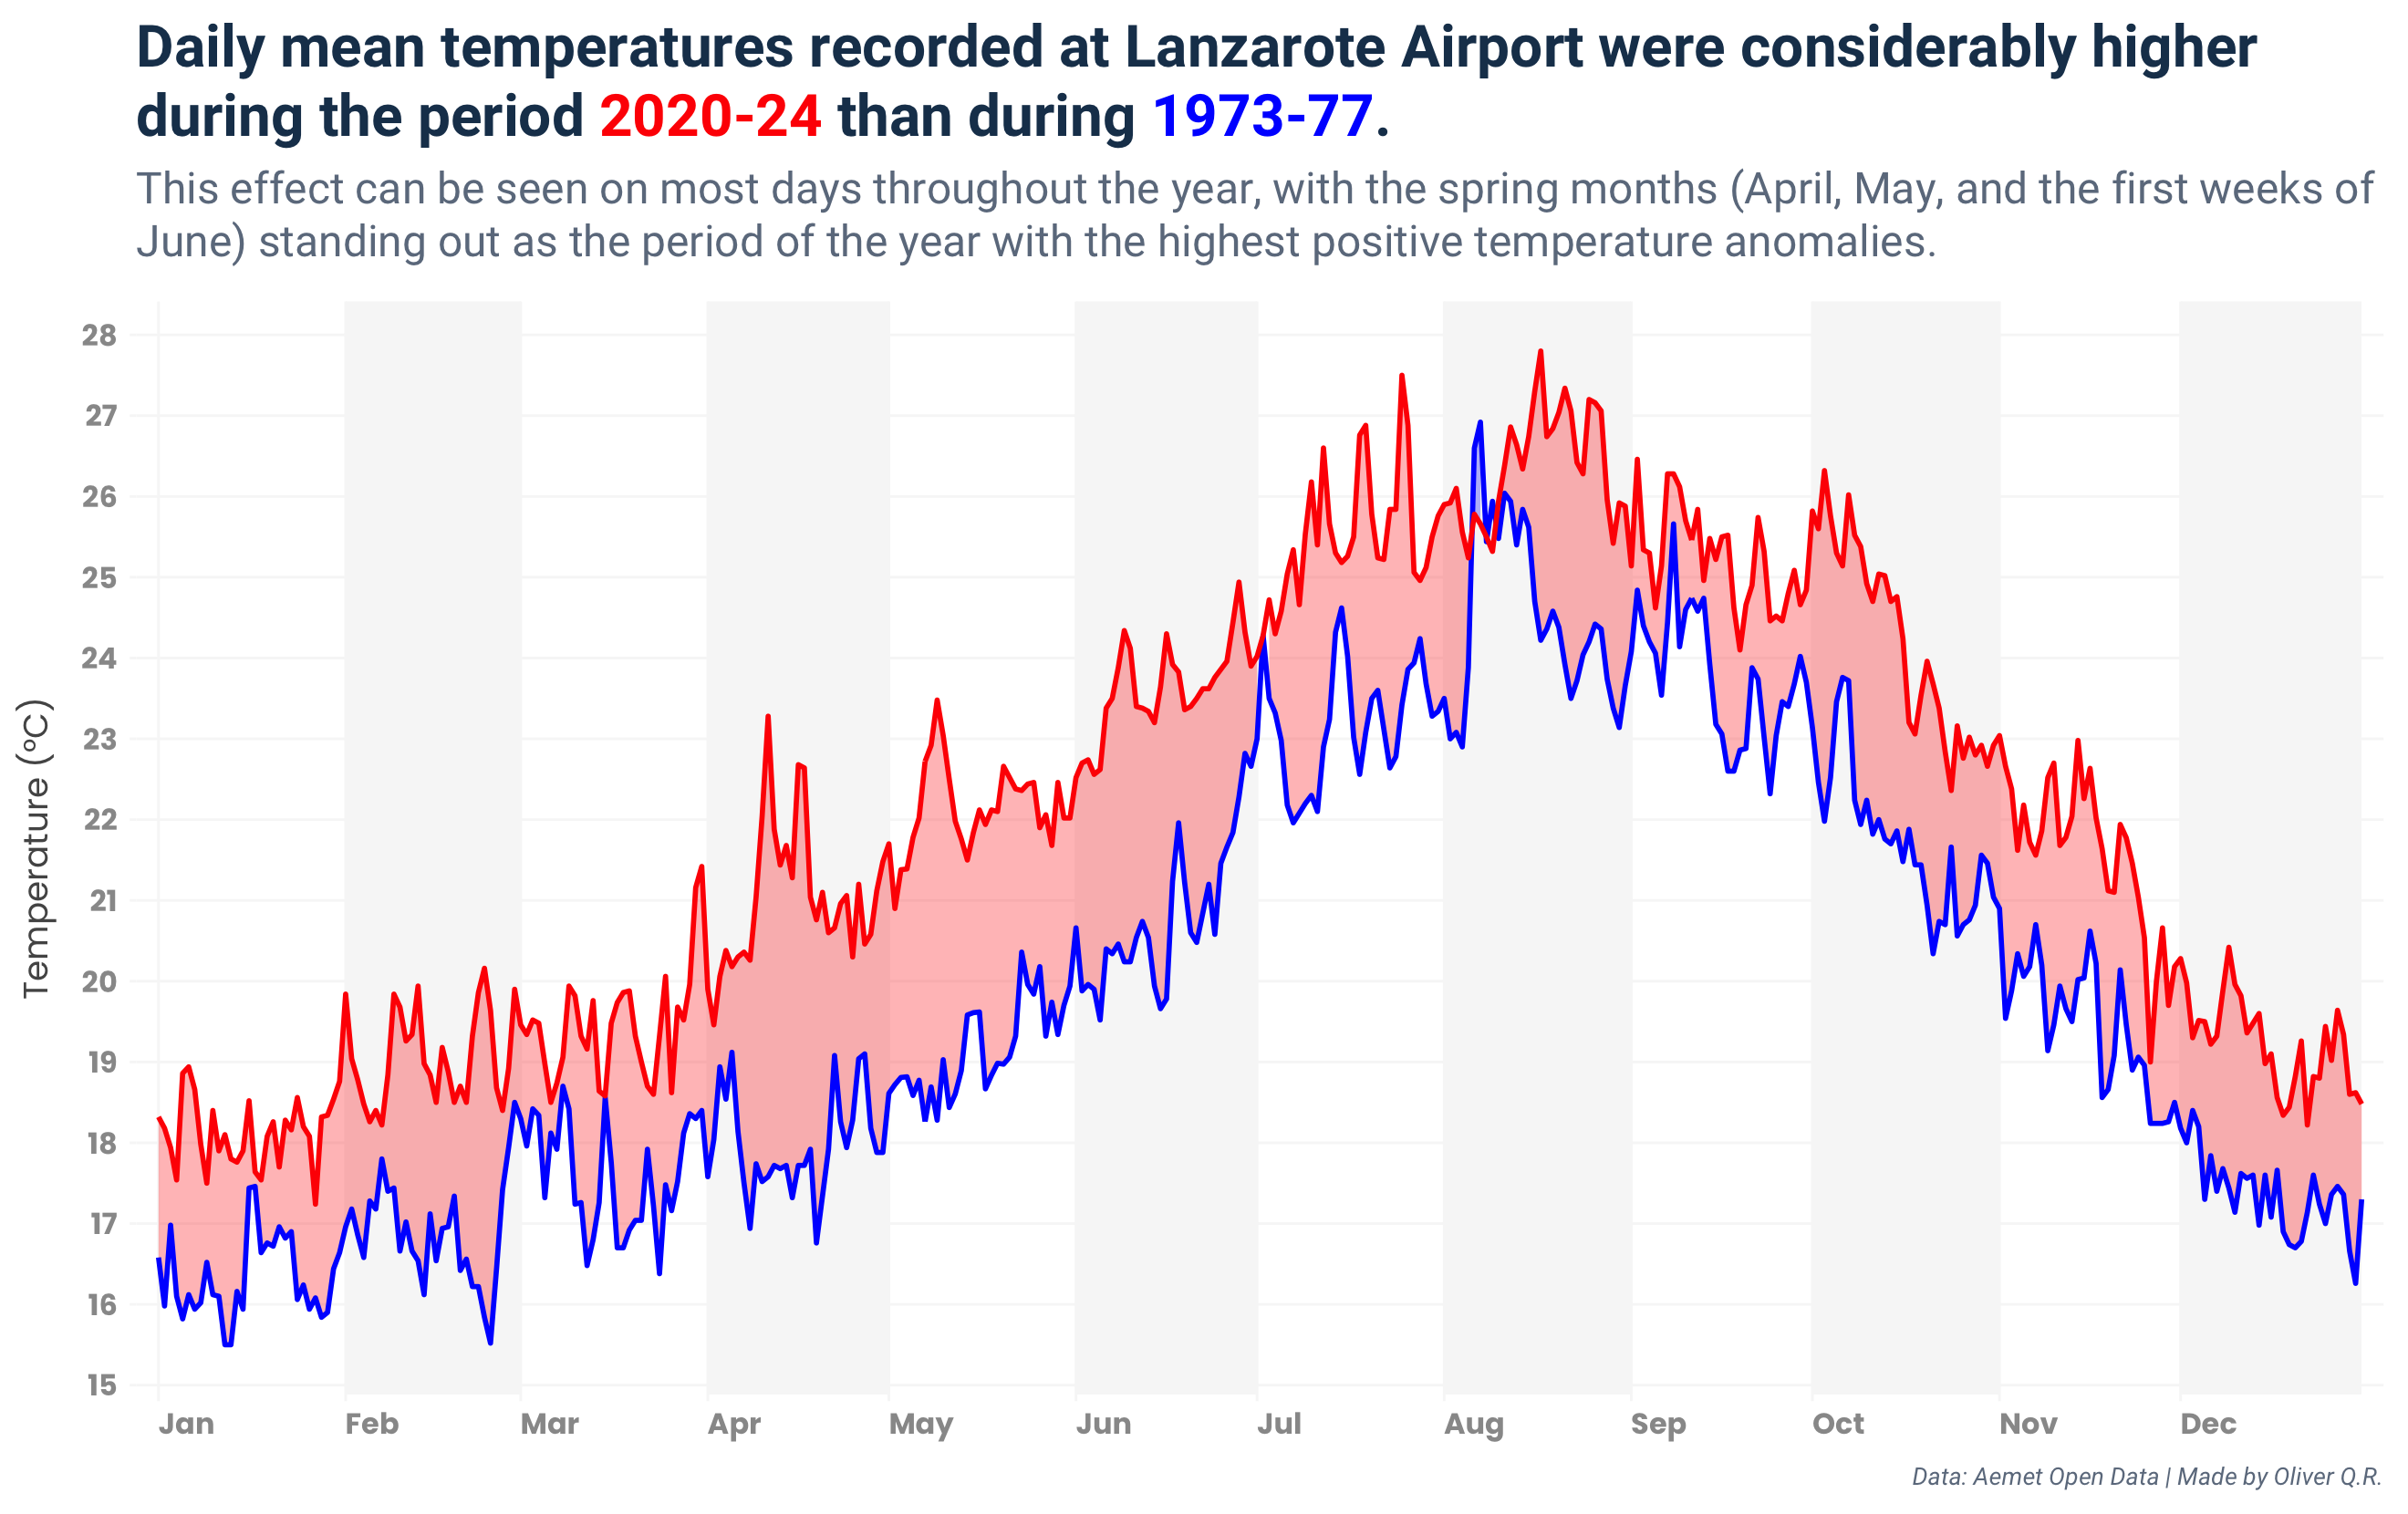
Daily mean temperatures during the period 2020-2024 (last five years) are considerably higher than in the period 1973-1977 (the first five years of the dataset). This trend can be seen for all months of the year, with spring months such as April, May, and June standing out (fig. 2; see this table for average monthly temperature per decade).
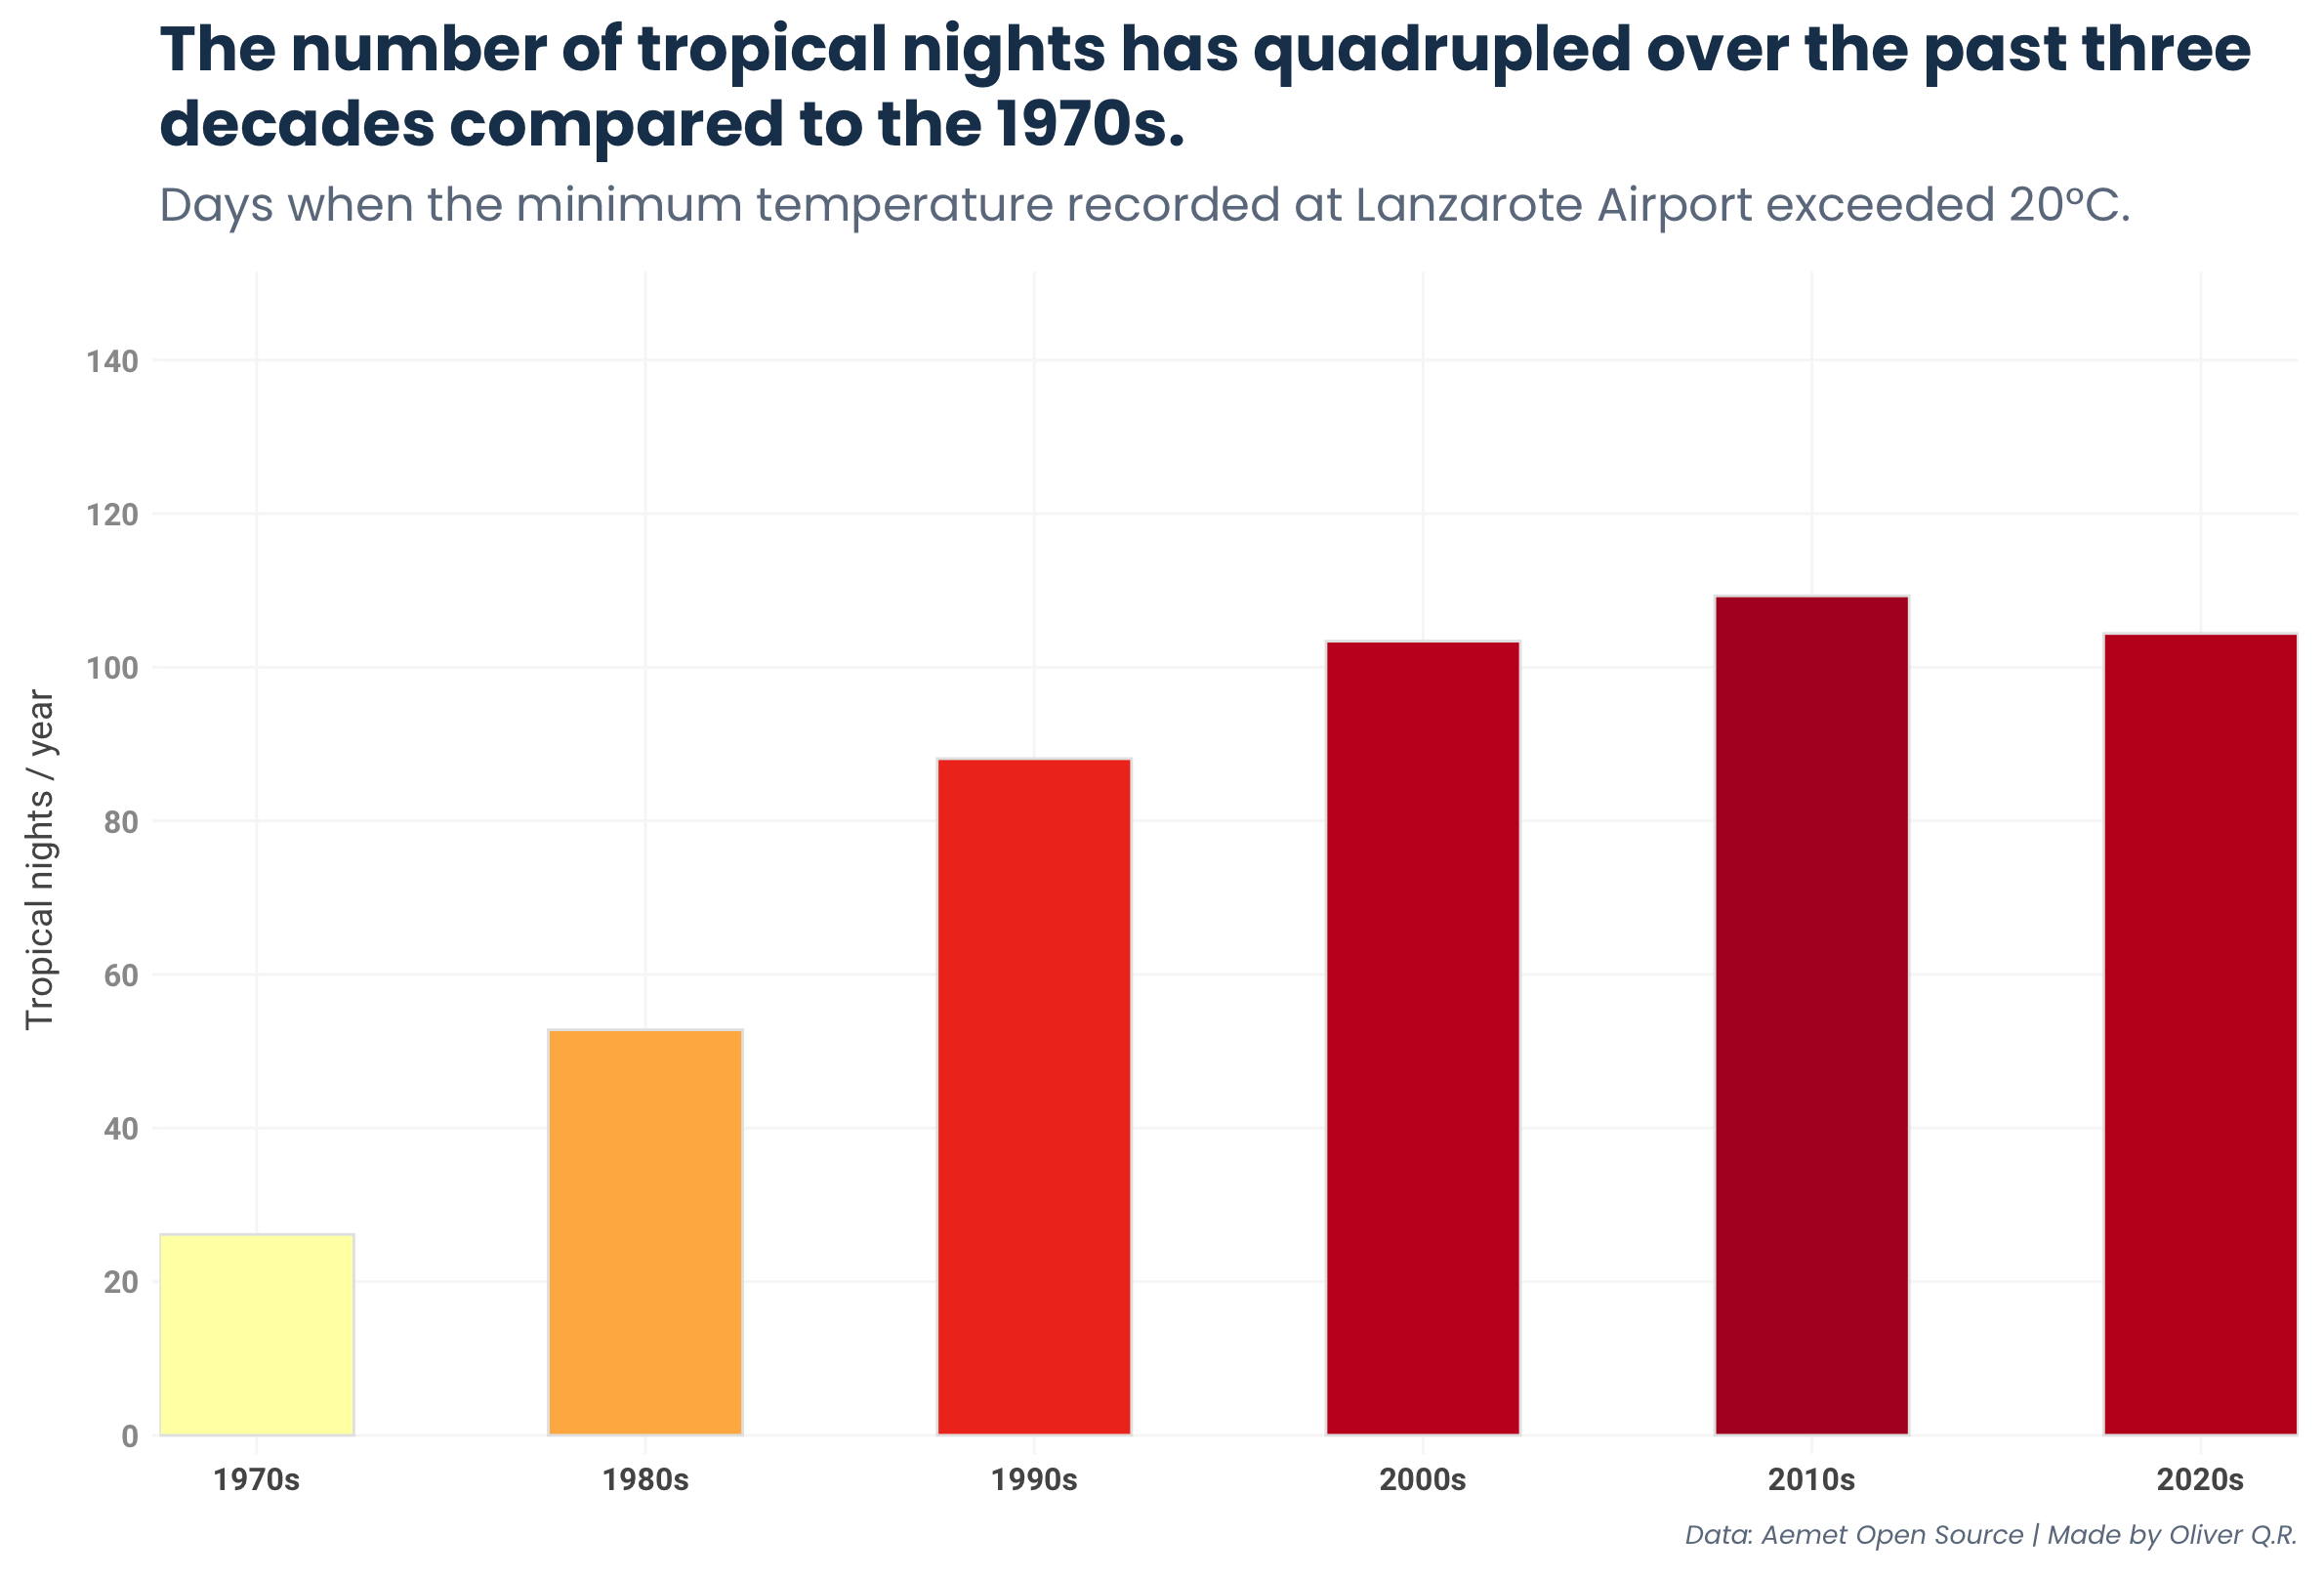
While the 1970s saw an average of 26 tropical nights per year (defined as days in which the minimum temperature recorded was above 20°C), this number has quadrupled over the past three decades, with recent years recording over 100 tropical nights annually (fig. 3).
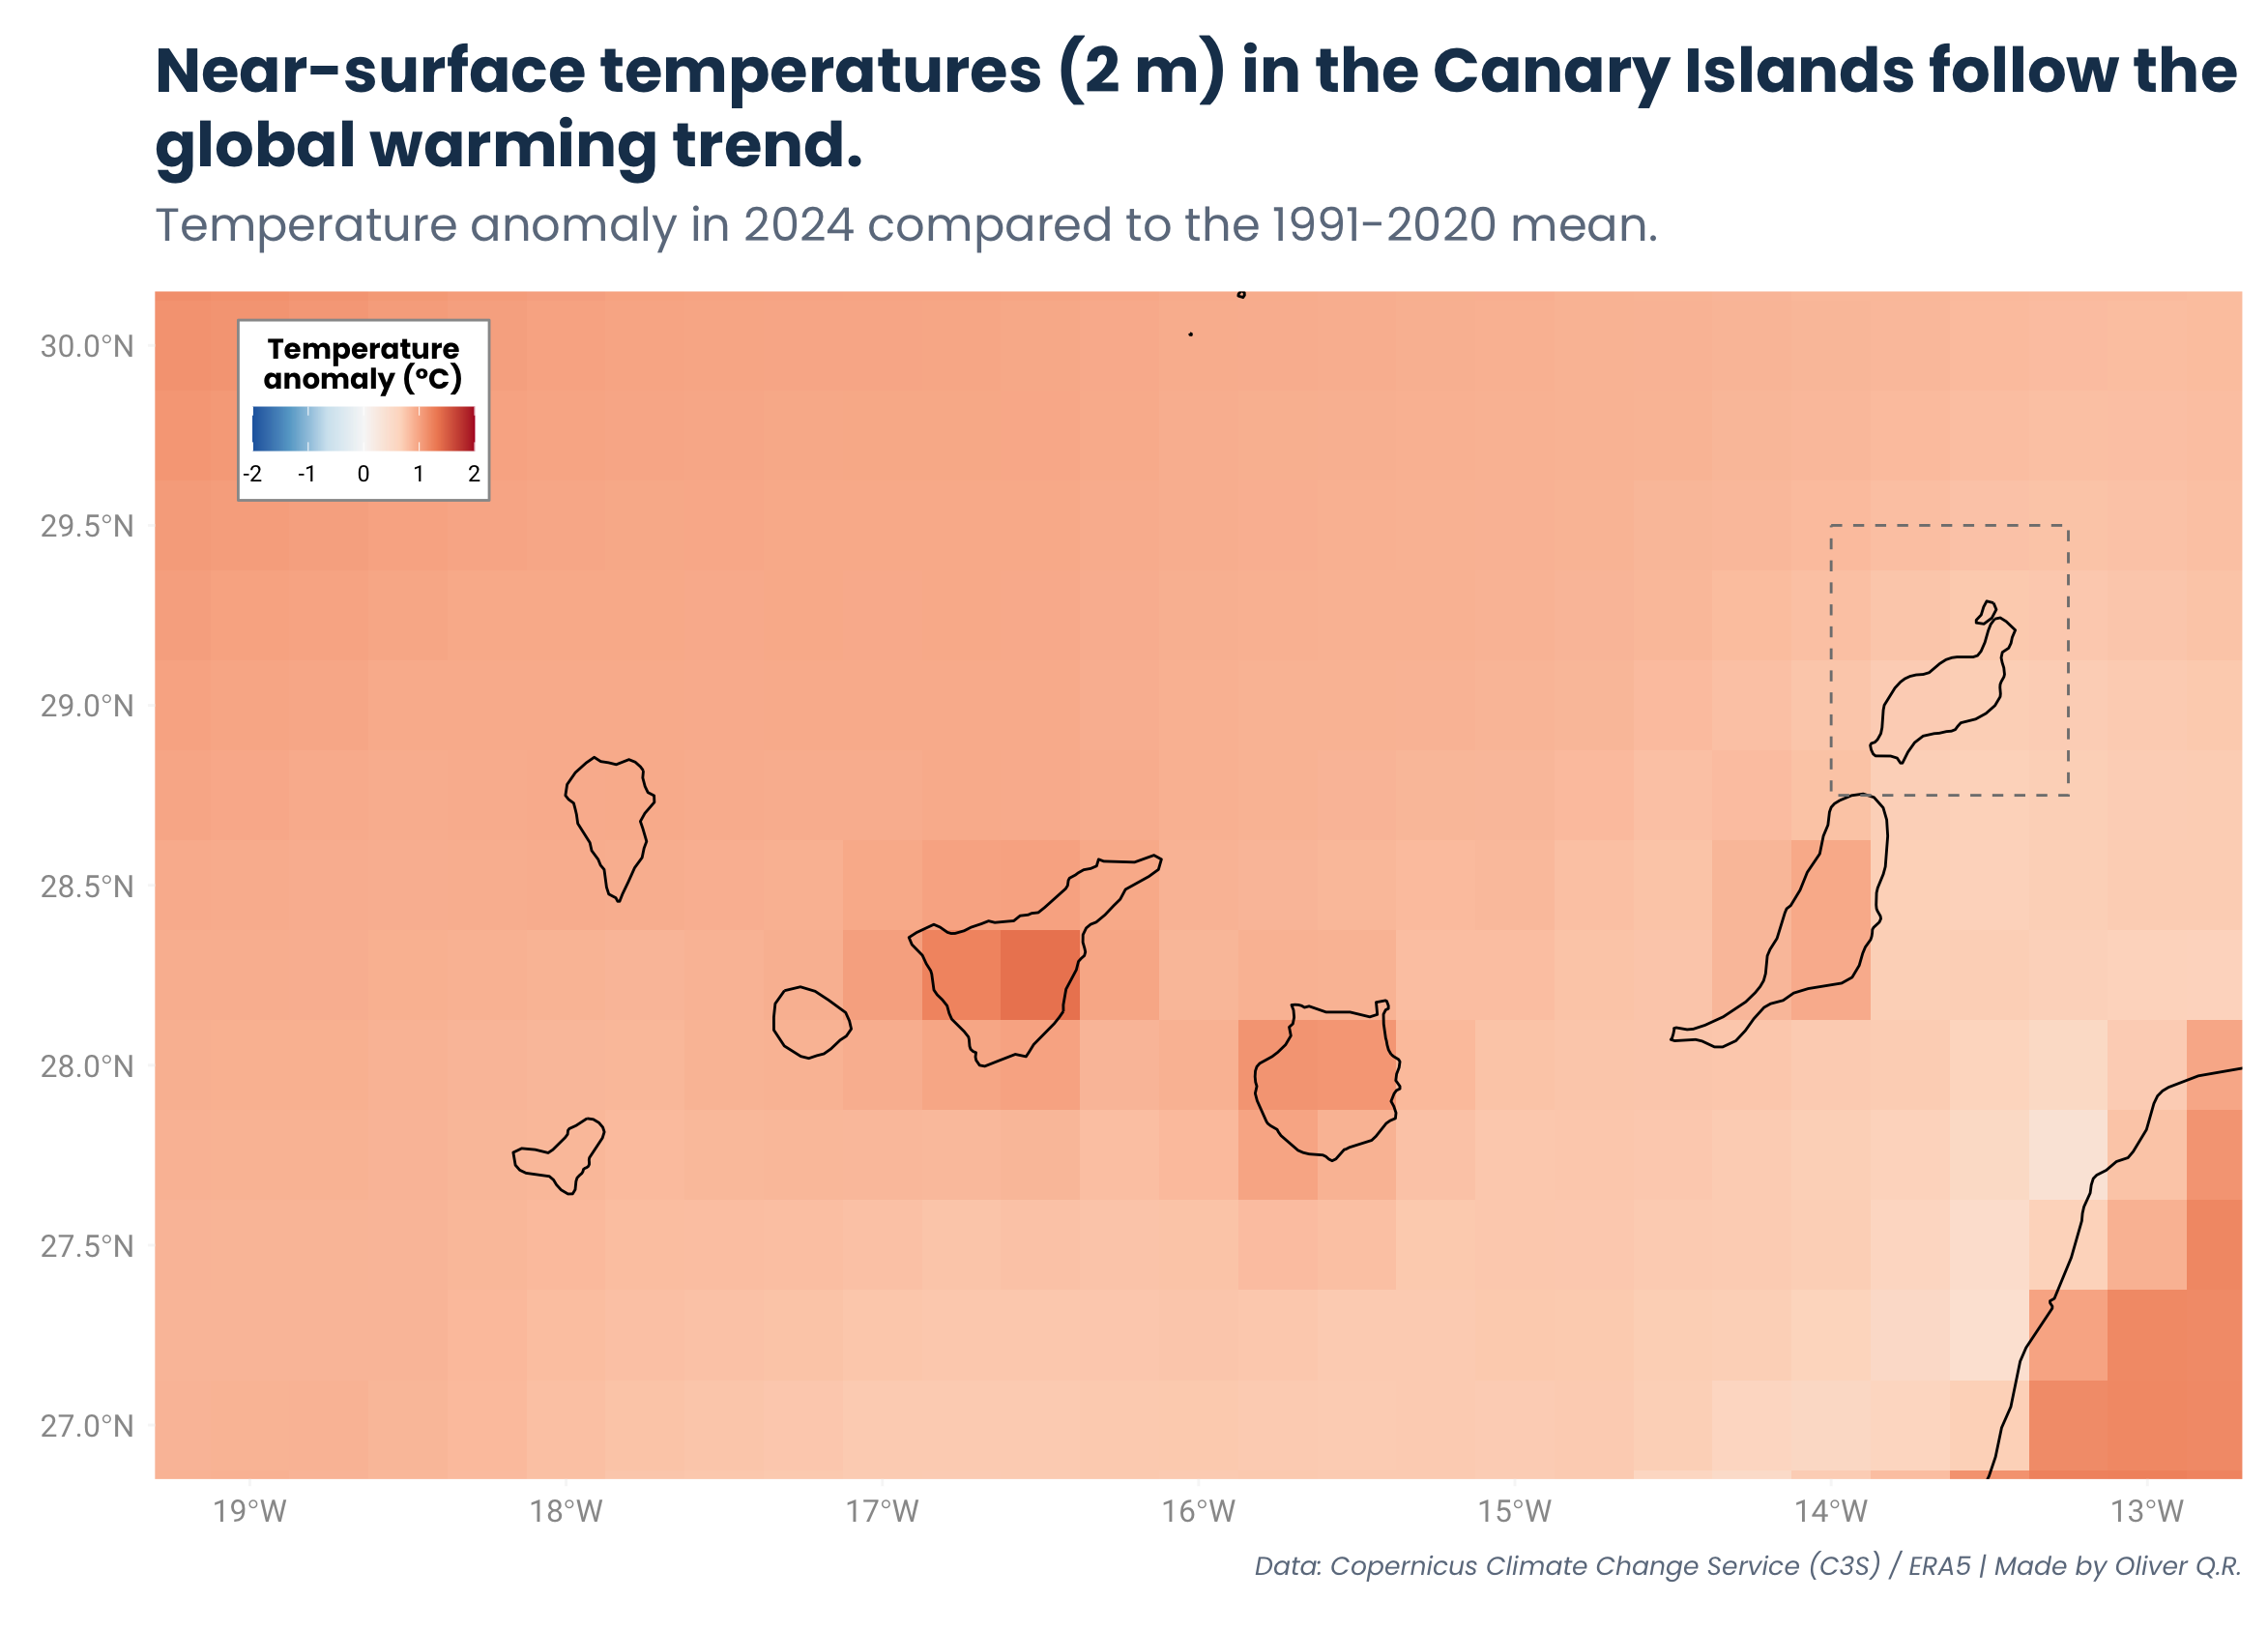
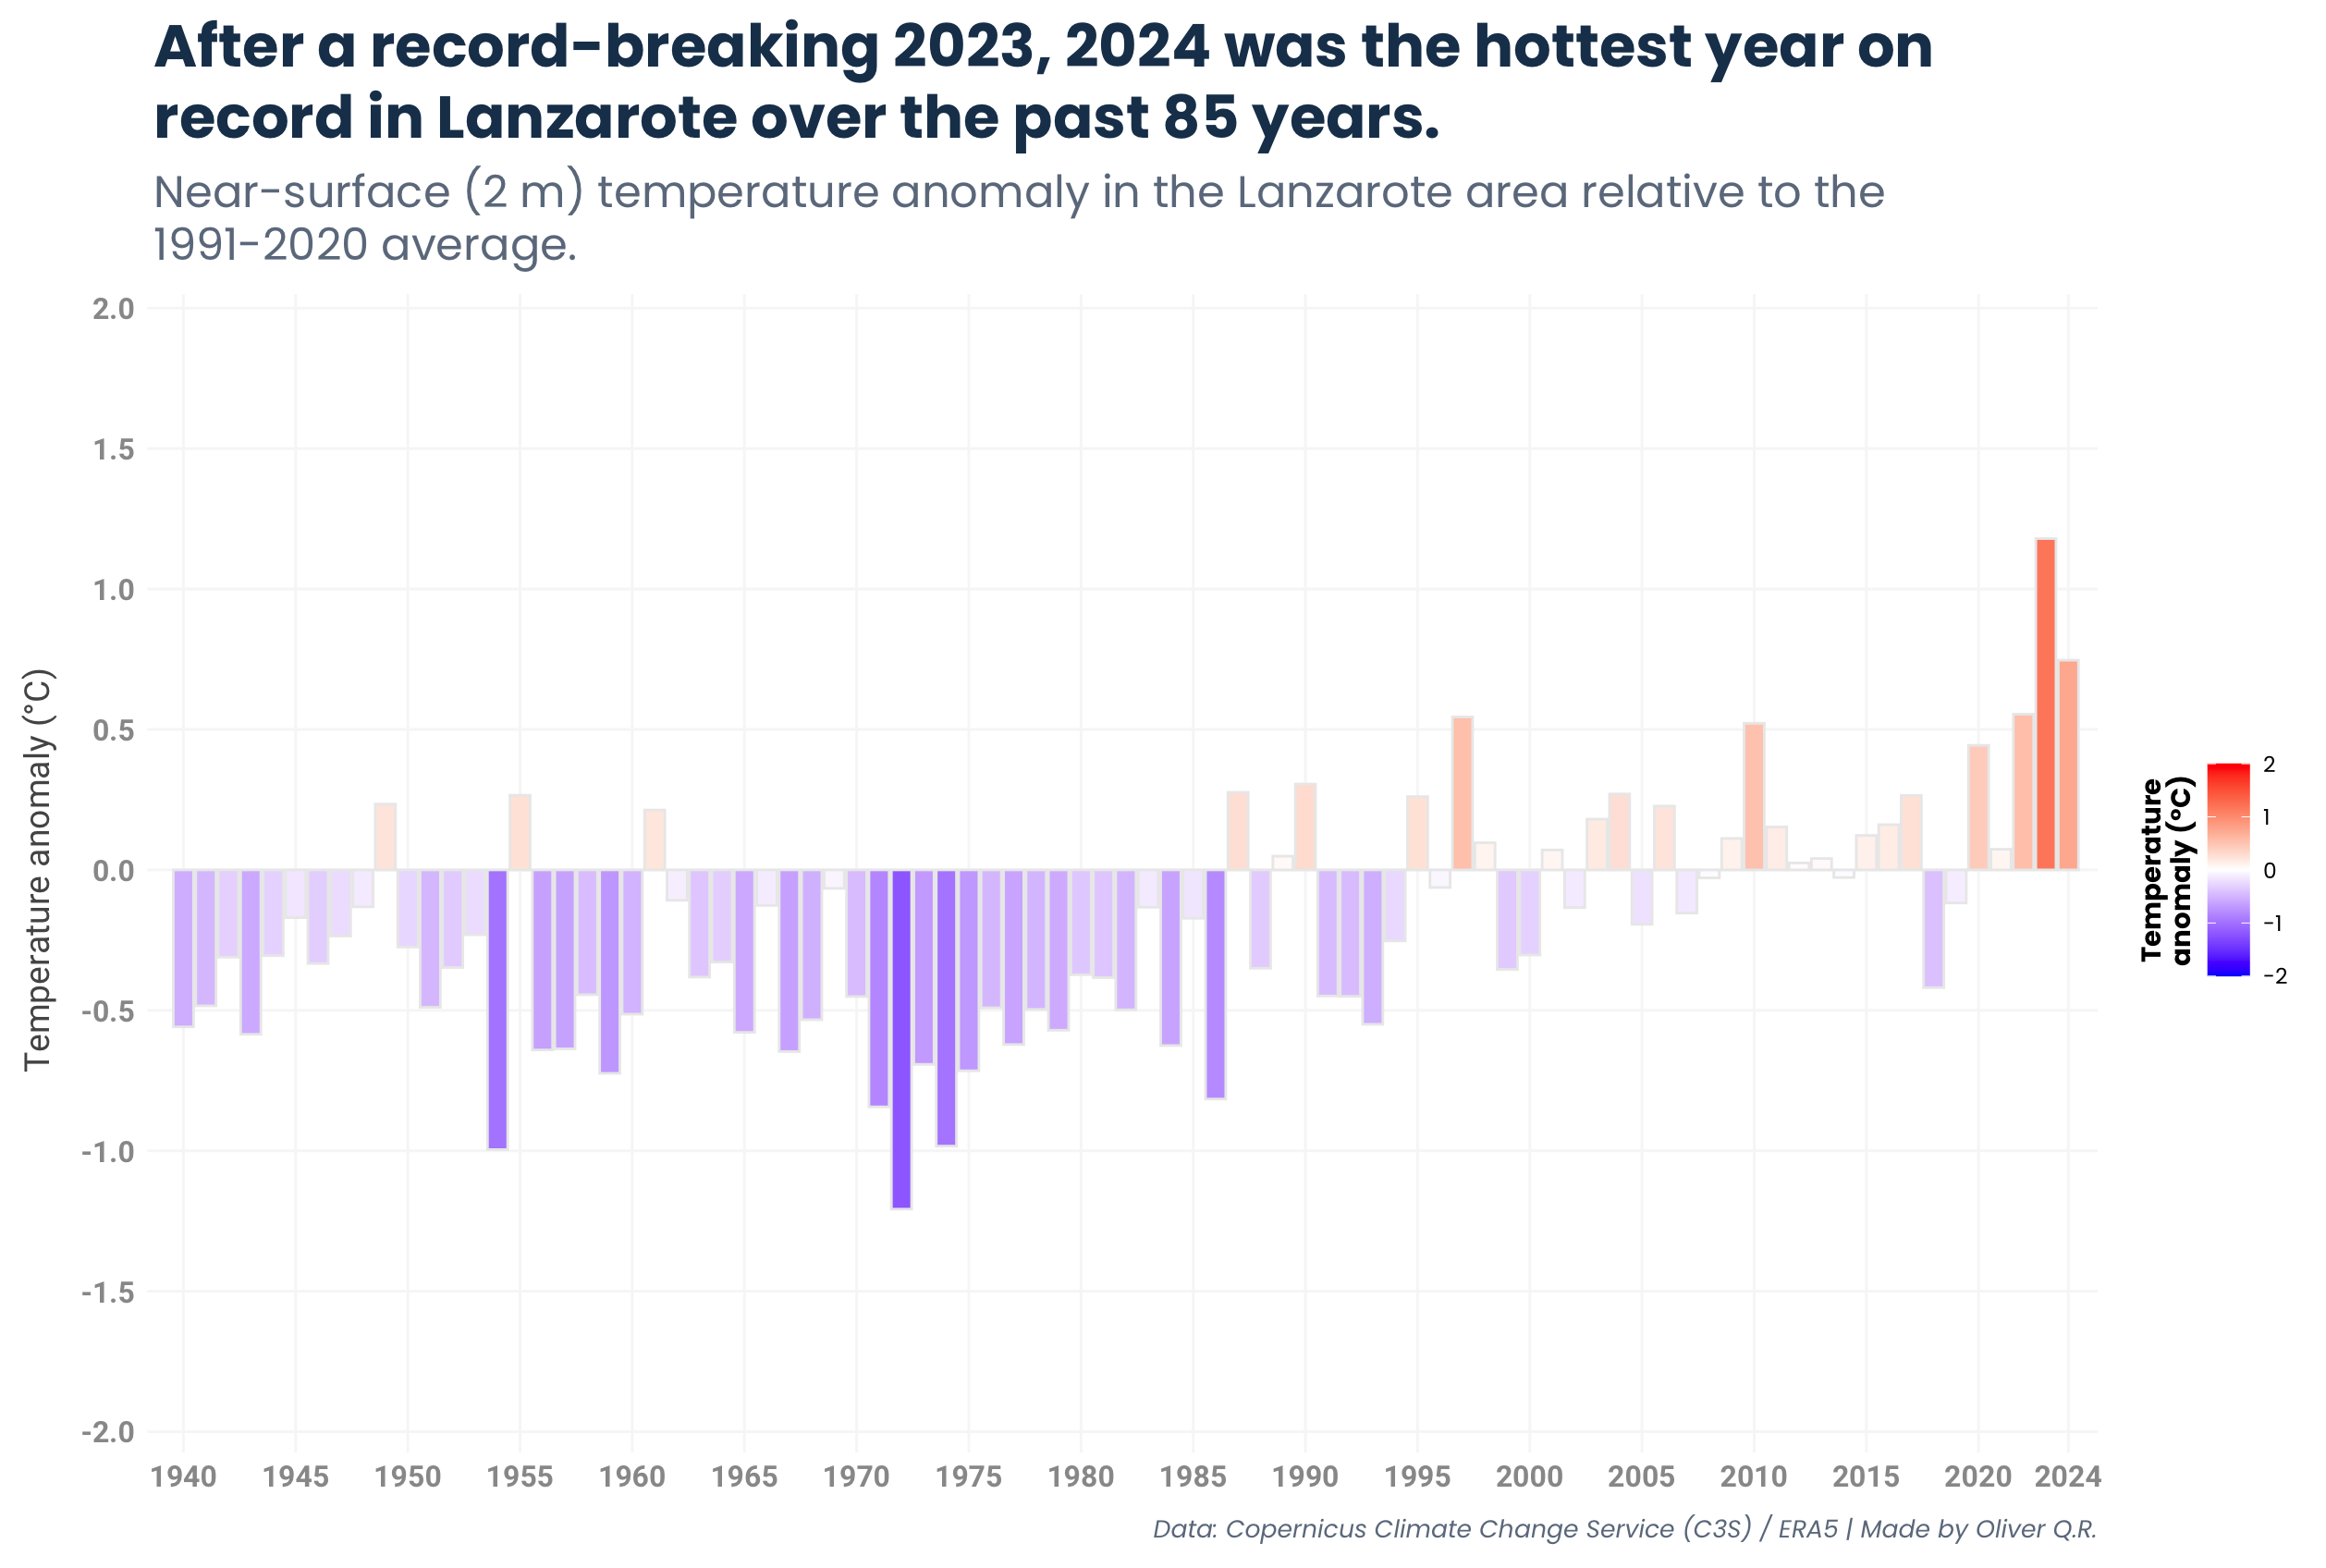
Copernicus data further confirm this warming trend (fig. 4 & 5). In 2024, near-surface temperature (measured 2 m above ground level) in the Lanzarote area was 0.7°C higher than the 1991-2020 average (fig. 4 & 5). This made 2024 the second warmest year on record, only behind the record-breaking 2023. Most of the years with positive temperature anomalies relative to the 1991-2020 average are recent (fig. 5), with the last three years standing out as the top 3 hottest (all of them showing anomalies greater than 0.5°C relative to the 1991-2020 mean, and ~1°C or higher than the 1941-1970 mean).
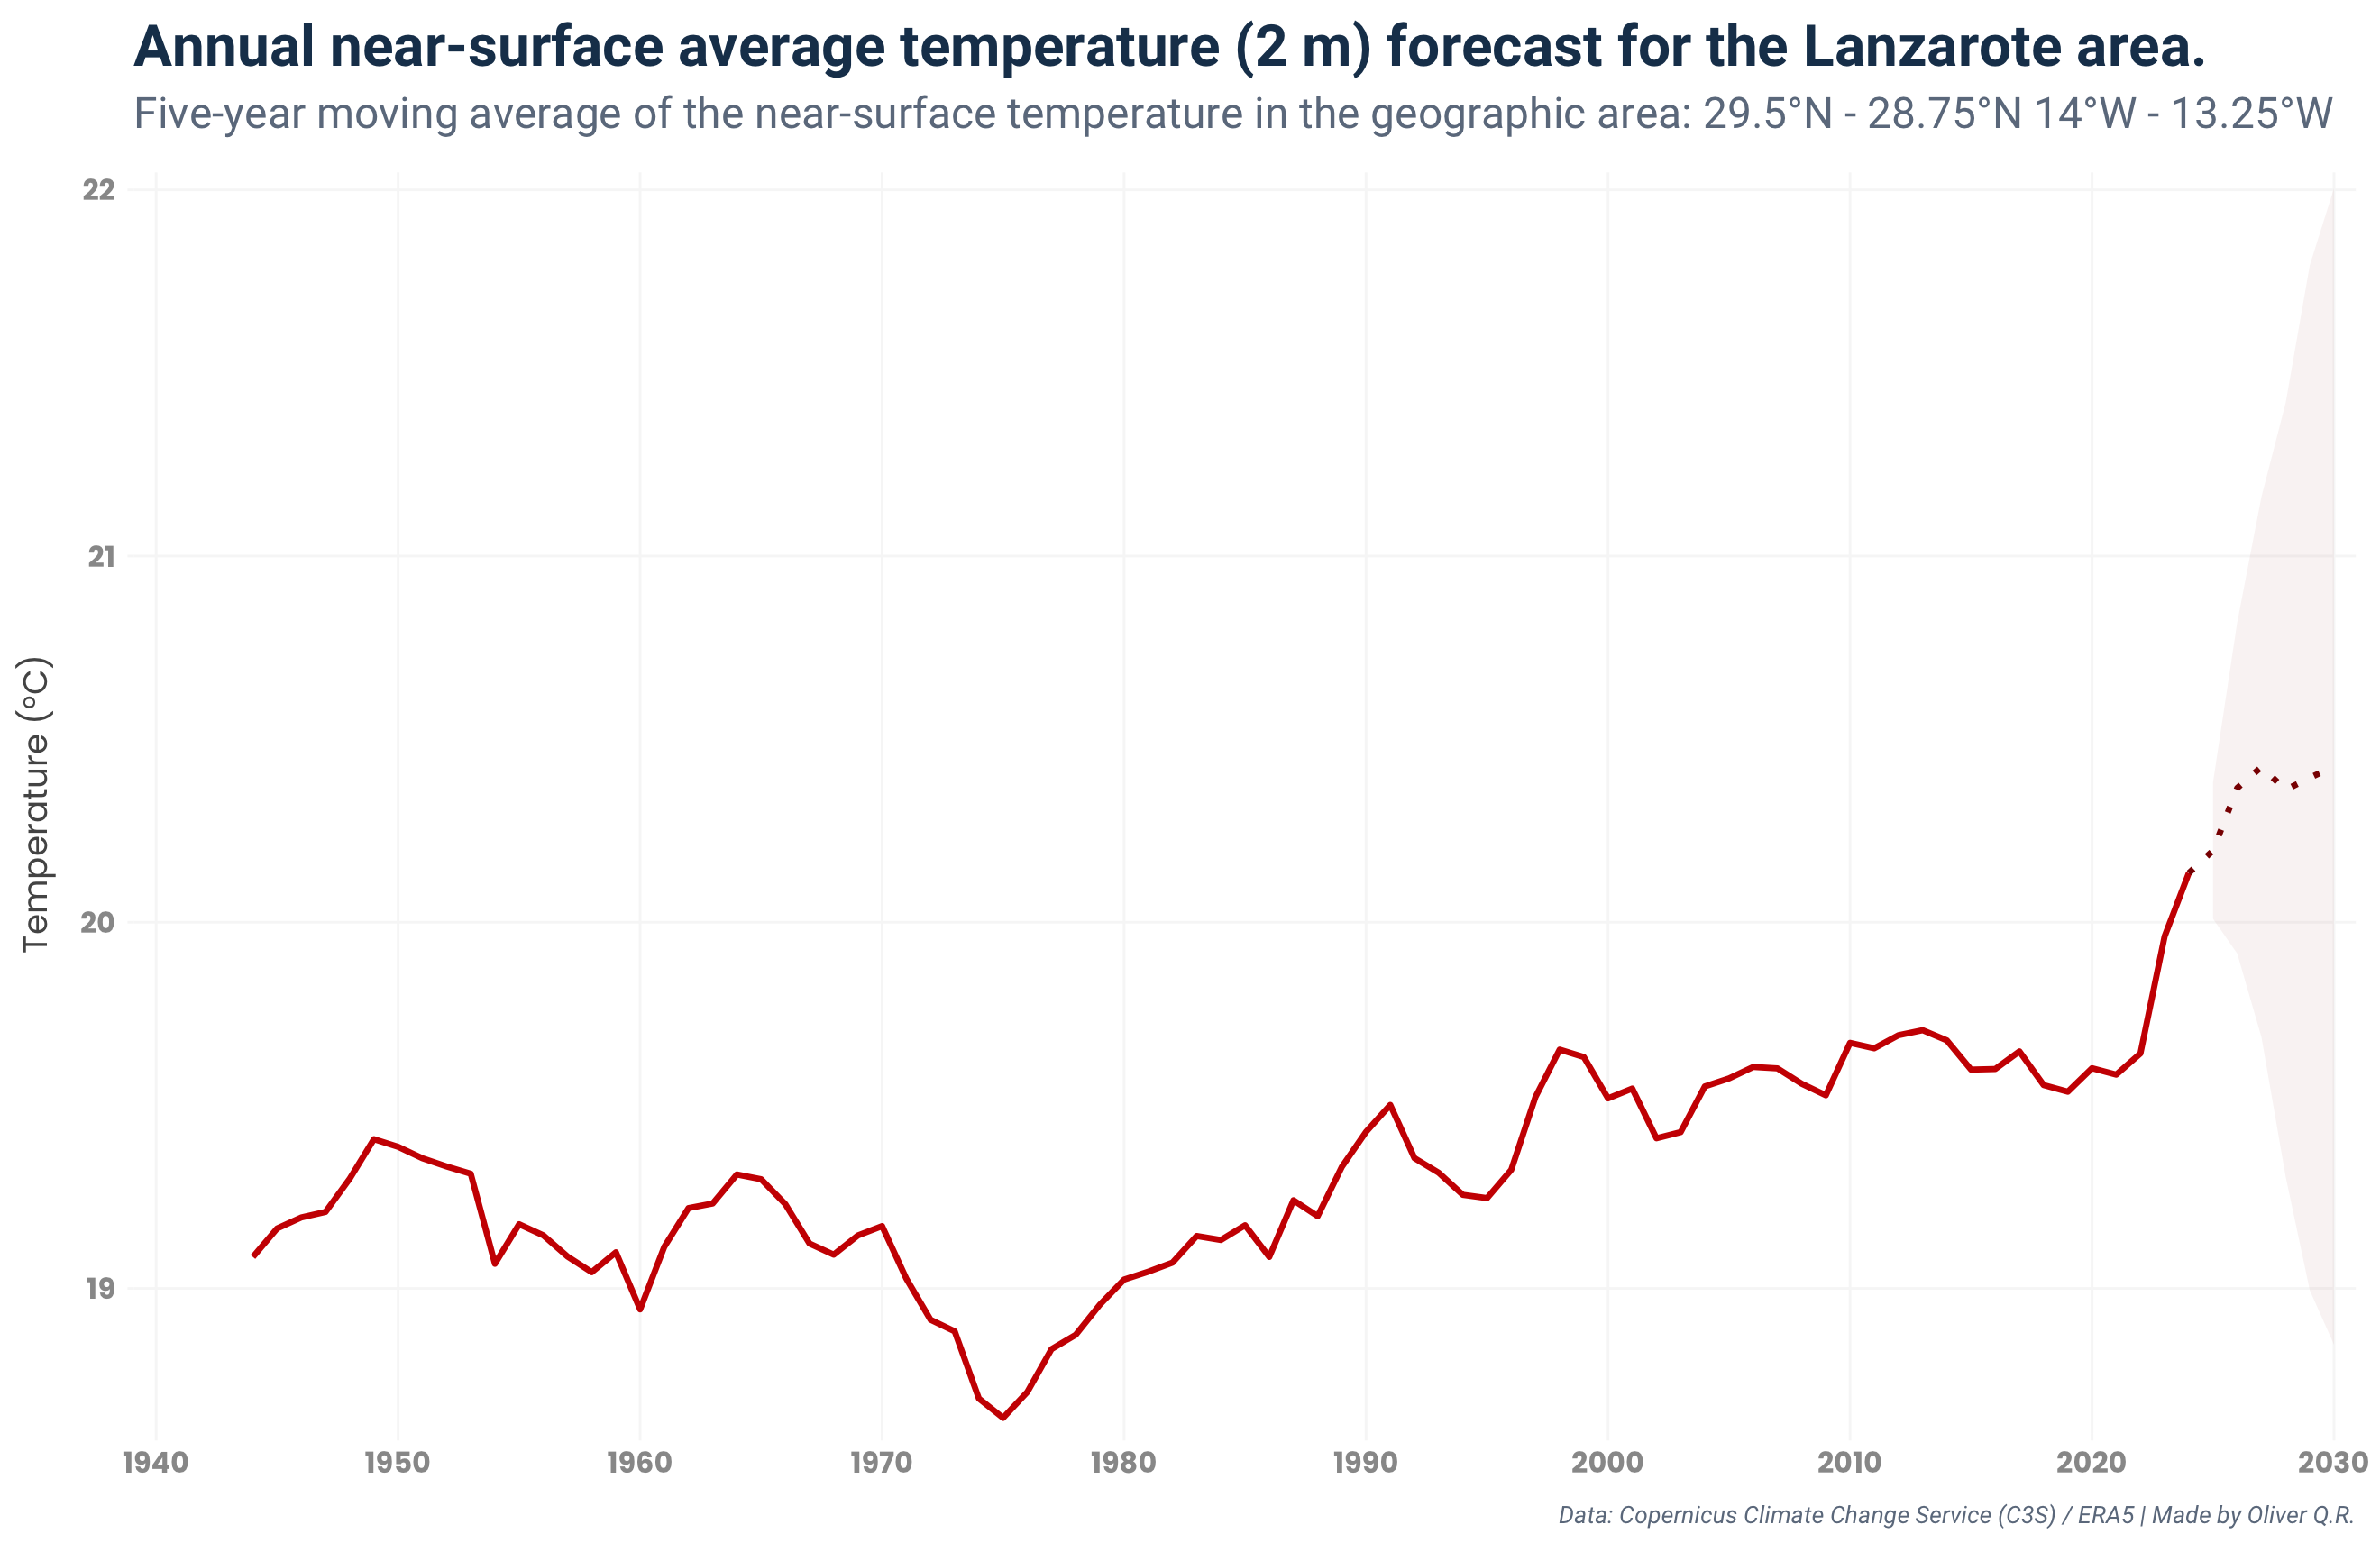
There is a clear pattern: temperatures are rising and this trend is likely to continue (see fig. 6 for a forecast for the next five years using a simple SARIMA model; MAPE: 2.21%, RMSE: 0.54). That's why, alongside mitigation efforts, we must prioritise the development of adaptation policies without delay.
How can we deal with this?
An ambitious plan could include the following:
- Creation of shaded areas using native and drought-resistant plants (parks, tree-covered pedestrian areas, etc.). This is especially important in areas affected by the urban heat effect, like Arrecife.
- Using reflective colours and construction materials (aligned with the island's traditional architecture) that reduce heating from direct sunlight.
- Reducing traffic across the island (particularly in high-traffic zones like Arrecife). To achieve this, measures to implement could include: development of an efficient public transport system; build a bike lane network across the island (wherever possible and, ideally, separated from general traffic lanes); expansion of tree-covered pedestrian areas in the cities; etc.
- Related to the previous point, creation of low-emission zones (especially in Arrecife).
- Restoring and expanding water-related infrastructure to allow, in an efficient manner, for the efficient placement of public fountains in strategic places, the development of tree-covered areas, etc.
- Tax incentives to accelerate the transition.
I believe these ideas, alongs with others shared here by Lanzarote Futuro, could help ensure a more liveable future for Lanzarote. There is no time to lose. The time to act is now.